I will declare that I am actually an avid abstractions fan.
Yeah, whether it’s logical abstraction or data abstraction. Whatever things that makes things seen differently are fun.
Good data visualization is one of those powerful abstractions I really like. It’s a way providing an effective means to make sense of data that can be tough to grasp numerically.
And when we talk about data visualization, we’ll eventually come to talk about data smoothing.

What Is Data Smoothing?
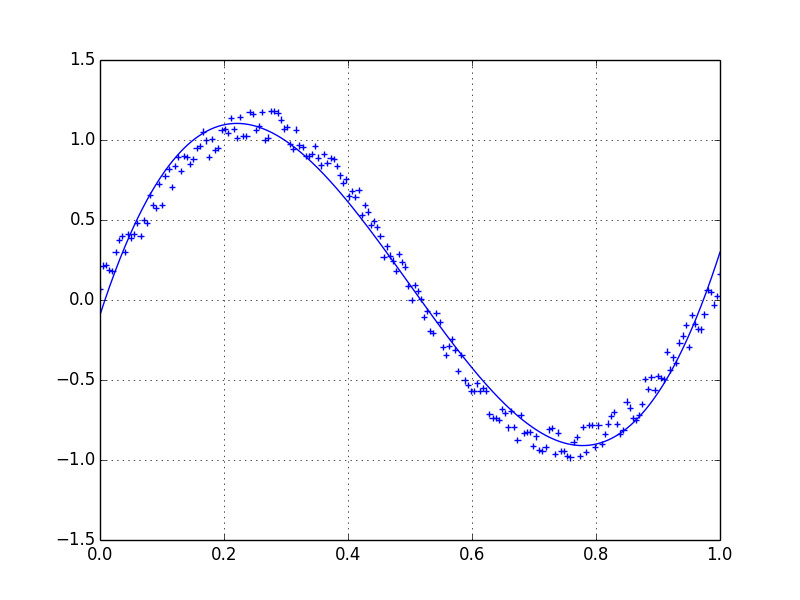
Data smoothing is basically techniques to make data less noisy. It’s a method to help reveal patterns and trends by reducing random fluctuations in the raw data.
Data smoothing techniques act as a digital filter for your data, eliminating unnecessary noise and revealing underlying patterns or trends.
Consider a scenario where you have a dataset representing monthly sales figures for a retail business. The raw data may show erratic spikes and dips due to various factors like promotions, seasonal changes, or one-time events. Applying data smoothing techniques is like gently smoothing out these peaks and valleys, providing a clearer picture of the overall sales trend. This process is akin to looking at the sales performance through a lens that emphasizes the broader patterns rather than the transient ups and downs.
So What Makes We Do It?
Other than making things looks discernible? Here’s what we can achieve with data smoothing:
- Improved Visualization: Makes it easier to spot trends and patterns.
- Noise Reduction: Filters out random fluctuations for a clearer picture.
- Trend Identification: Helps identify long-term trends by minimizing short-term variations.
- Enhanced Predictability for Forecasting: Leads to more accurate predictions by removing irrelevant fluctuations.
But It Is Not A Silver Bullet
However, it’s important to exercise caution when employing data smoothing techniques.
Data smoothing involves manipulating the data, which can result in slight differences or even data losses. Consequently, presenting only the smoothed data and completely ditching the original dataset can be misleading. Real data should always hold its merit to provide accurate context.
There Are Many Ways To Do It
Just like how there are many image filters in Instagram, there are also many techniques we can apply to smooth datas. Here are some well known methods:
- Moving Averages: Calculate averages over a set window of data points. (Learn more)
- Exponential Smoothing: Gives more weight to recent observations by using decreasing weights for older ones. (Learn more)
- Exponential Moving Average: Basically exponential smoothing over moving averages.
- Savitzky-Golay Filter: A polynomial smoothing technique that keeps important features in the data. (Learn more)
- Resampling: Aggregating data across a specified duration, providing a more comprehensive view. (Learn more)
- Spline Interpolation: A method of smoothing that involves fitting a piecewise-defined curve to the data points. (Learn more)
There are probably still many others available to explore other than those I mentioned.
Closing Words
Data smoothing, those methods, used carefully, will help us make our data more understandable and support better decision-making.
But again as with any data manipulation, caution is advised.
Always consider the potential impact on accuracy and context when employing data smoothing techniques. Real-world data, in its raw form, remains a valuable reference point for comprehensive understanding.